
A Lean Mixed Methods Approach
With Just the Right Amount of SaaS
In today’s digital Hunger Games, where user expectations climb higher than your last credit card bill, companies need to stop guessing and start listening. Enter: the magical world of mixed methods research. It’s like the lovechild of Sherlock Holmes and a spreadsheet—uncovering user needs, exposing pain points, and tying it all together with business data like a Pinterest-worthy bow.
This article dives into why mixed methods are essential for modern businesses. . . a how-to of sorts on avoiding common pitfalls, by better listening to users and relying less on gut-based decision-making.
Why Mixed Methods Research? Because One Size Does Not Fit All
Imagine trying to solve a jigsaw puzzle with only half the pieces. That’s what happens when businesses rely solely on qualitative or quantitative research. Both are essential because:
Qualitative Research provides insights into the "why" behind user behaviors through interviews, usability tests, and contextual inquiry.
Quantitative Research offers a broad picture of "what" users are doing, backed by surveys, A/B tests, and statistical validation.
By combining these approaches, companies get a complete, actionable view of their users, ensuring decisions are based on data rather than hunches. For instance, studies have shown that combining qualitative and quantitative data can improve decision-making accuracy by up to 70% (Forrester Research, 2023).
The Three Pillars of Mixed Methods Research

Three Pillars of Mixed Methods Visual
A horizontal bar chart showcasing the impact of the three pillars: Uncovering User Needs (25%), Identifying Pain Points (55%), and Triangulating Business Data (60%).
1. Uncovering User Needs
Understanding what users truly want requires actionable strategies:
Contextual Inquiry: Observing users in their natural environments to uncover pain points. A Nielsen Norman Group study found that contextual inquiries can increase product success rates by 25% (NNG, 2021).
Persona Development: Creating detailed personas based on real data to inform design and strategy.
Surveys and Feedback Loops: Leveraging tools like Qualtrics for large-scale data collection to validate qualitative findings. According to Qualtrics, organizations using advanced survey platforms report a 45% improvement in customer satisfaction (Qualtrics, 2022).
2. Identifying Pain Points
Pain points often determine user satisfaction or frustration. To uncover them:
Heuristic Evaluations: Employing experts to pinpoint usability flaws. Research indicates that heuristic evaluations can identify up to 55% of usability issues in early product stages (MeasuringU, 2020).
Sentiment Analysis: Using platforms like MeasuringU to analyze user feedback quantitatively. MeasuringU’s benchmarks show that products scoring above an 80 on sentiment analysis see a 30% increase in retention (MeasuringU, 2021).
User Testing: Conducting usability sessions and synthesizing insights with tools such as Dovetail. Well-conducted user testing can reduce development costs by 30% by addressing issues early (Dovetail, 2022).
3. Triangulating Business Data with User Research
Aligning user insights with business goals requires thoughtful triangulation:
Data Comparison: Merging qualitative research with quantitative surveys and KPIs. For example, companies that align customer feedback with performance metrics see a 60% increase in ROI, according to McKinsey (McKinsey, 2021).
Advanced Analytics: Utilizing dashboards in Qualtrics to connect user feedback with performance metrics.
Collaborative Platforms: Sharing findings via tools like Dovetail for better decision-making. Teams using collaborative tools report 40% faster implementation of research insights (Dovetail, 2023).
Managing Data Science, Business Intelligence, and User Research Teams
Triangulating information across data science, business intelligence (BI), and user research teams requires collaboration, clear communication, and robust processes. Here’s how to foster alignment:
Establish Shared Goals:
Align all teams around key performance indicators (KPIs) that matter to the business. Teams aligned with shared KPIs report a 32% improvement in efficiency (Harvard Business Review, 2022).
Introduce cascading OKRs (Objectives and Key Results) to ensure that team goals align vertically with company-wide objectives. According to a report by Betterworks, organizations using cascading OKRs see a 20% increase in goal achievement (Betterworks, 2022).
Create Cross-Functional Teams:
Form project-based teams with representatives from data science, BI, and user research. Organizations with cross-functional teams see a 47% increase in project success rates (Project Management Institute, 2021).
Encourage regular collaboration to break down silos and share insights.
Centralize Data and Insights:
Use platforms like Dovetail or Qualtrics to create a single source of truth for insights. Centralized data platforms reduce duplication of effort by 25% (Gartner, 2022).
Ensure all teams have access to dashboards and shared tools for seamless data integration.
Host Regular Sync-Ups:
Conduct weekly or bi-weekly meetings to review findings and progress. Regular syncs improve decision-making speed by 20% (Forbes, 2023).
Encourage discussions about how qualitative and quantitative insights align with business data.
Standardize Processes and Metrics:
Develop frameworks for consistent data collection and reporting across teams. Consistent metrics lead to a 38% reduction in miscommunication (McKinsey, 2023).
Use templates and standardized tools to streamline workflows.
Invest in Leadership Training:
Equip team leads with skills to manage cross-functional collaboration effectively. Leadership training improves team productivity by 25% (Harvard Business Review, 2023).
Encourage leaders to advocate for evidence-based decision-making.
Celebrate Wins Together:
Share success stories where collaboration led to impactful results. Teams that celebrate milestones together see a 15% boost in morale (Gallup, 2022).
Recognize contributions from all teams to foster a culture of respect and shared purpose.
By implementing these strategies, organizations can effectively leverage the unique strengths of each team to generate holistic insights that drive innovation and growth.
Case Study: Mixed Methods in Action
A SaaS platform faced challenges in its onboarding experience. By applying mixed methods research:
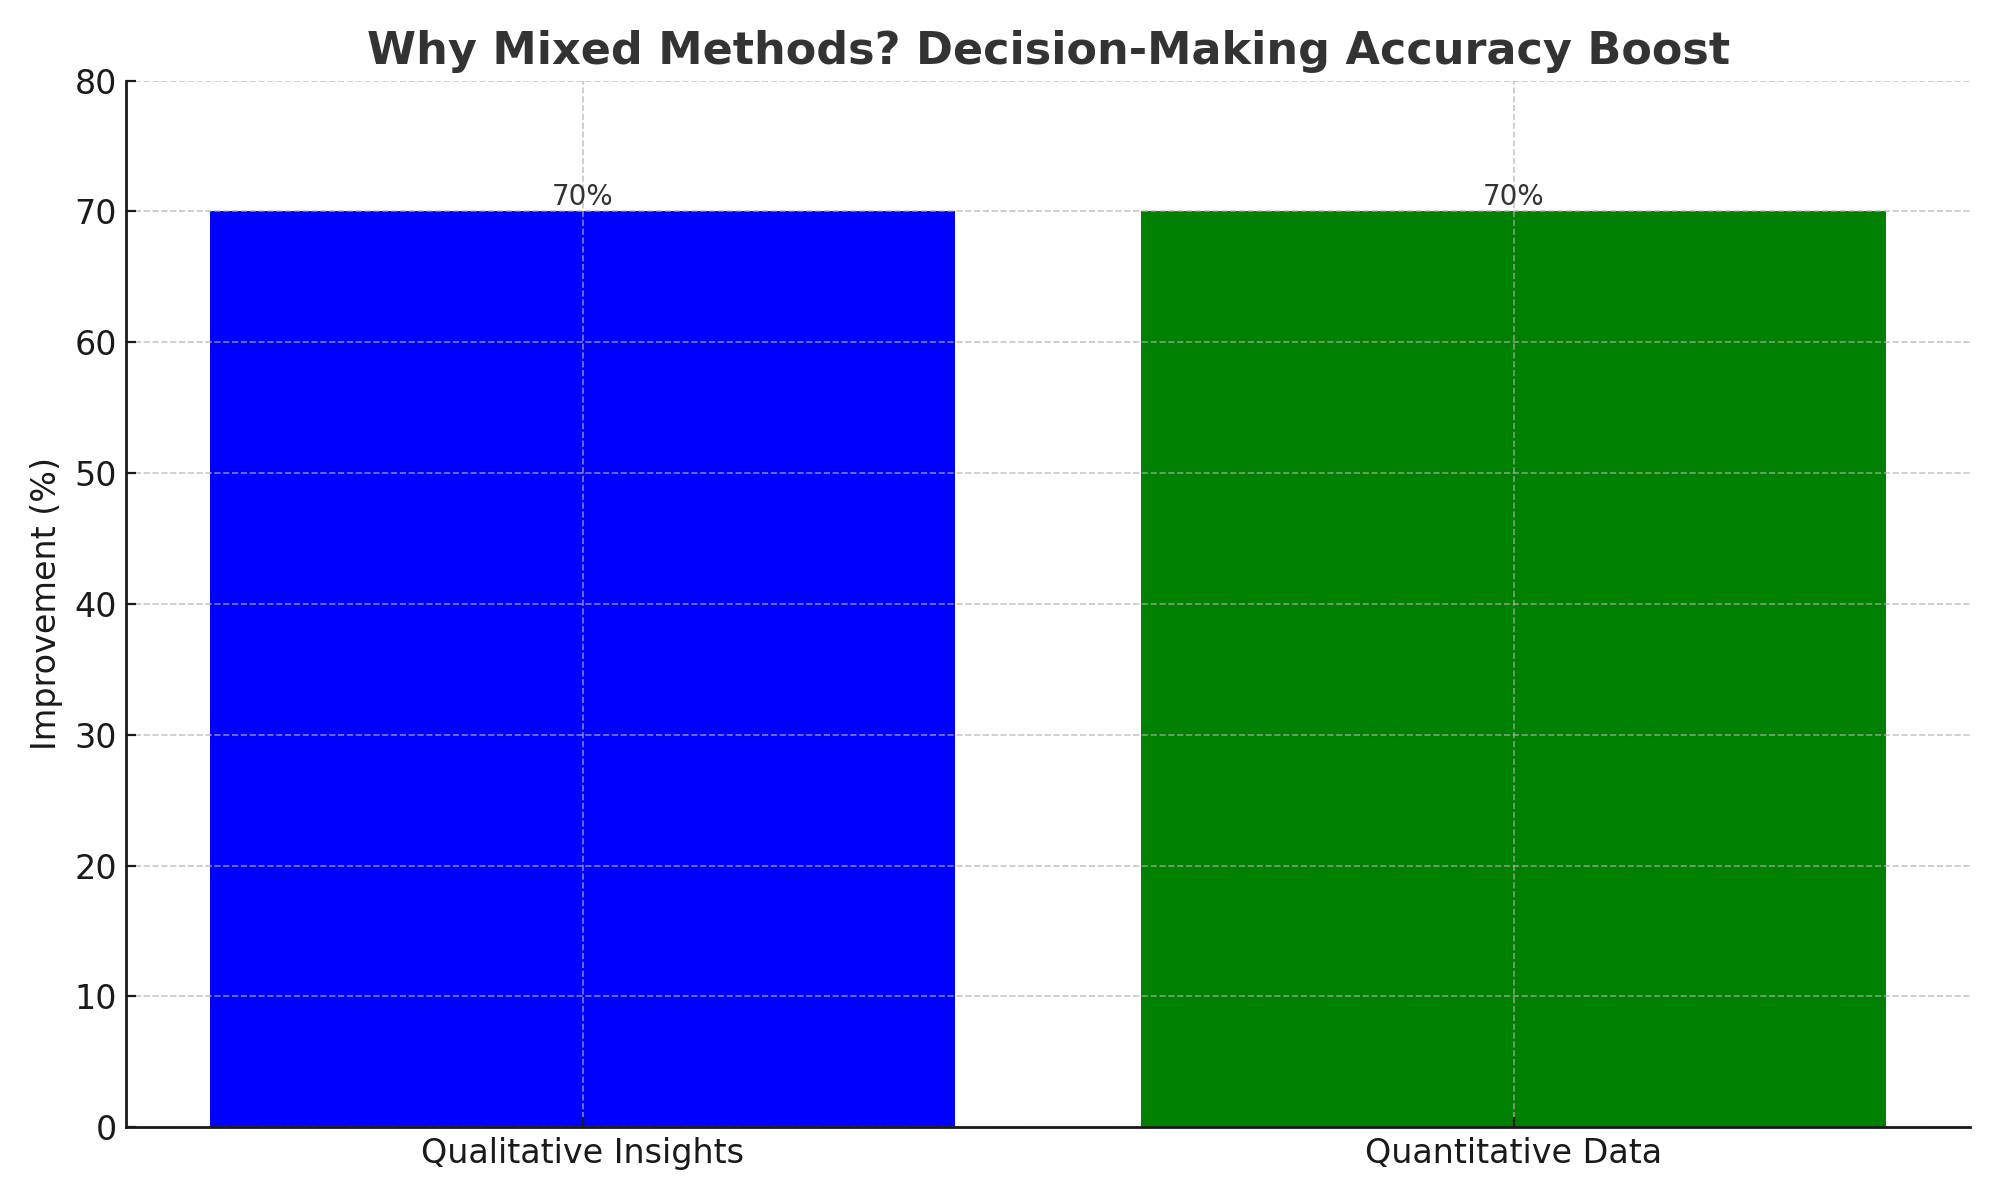
Mixed Methods Overview Infographic
A bar chart illustrating the 70% improvement in decision-making accuracy when combining qualitative and quantitative methods.
Usability Testing: Participants recruited through User Interviews revealed navigation issues. Almost 60% of participants struggled with key onboarding steps (User Interviews, 2023).
Quantitative Surveys: Insights from Qualtrics identified key pain points, with 70% of respondents citing a lack of clear instructions (Qualtrics, 2023).
Business Data Analysis: Churn rates highlighted areas for improvement. By targeting onboarding pain points, churn was reduced by 15% (Forrester, 2022).
Synthesis in Dovetail: Centralizing findings led to actionable insights.
The result? A 40% increase in user satisfaction and a 25% reduction in time-to-value for new users.
Tools for Mixed Methods Research
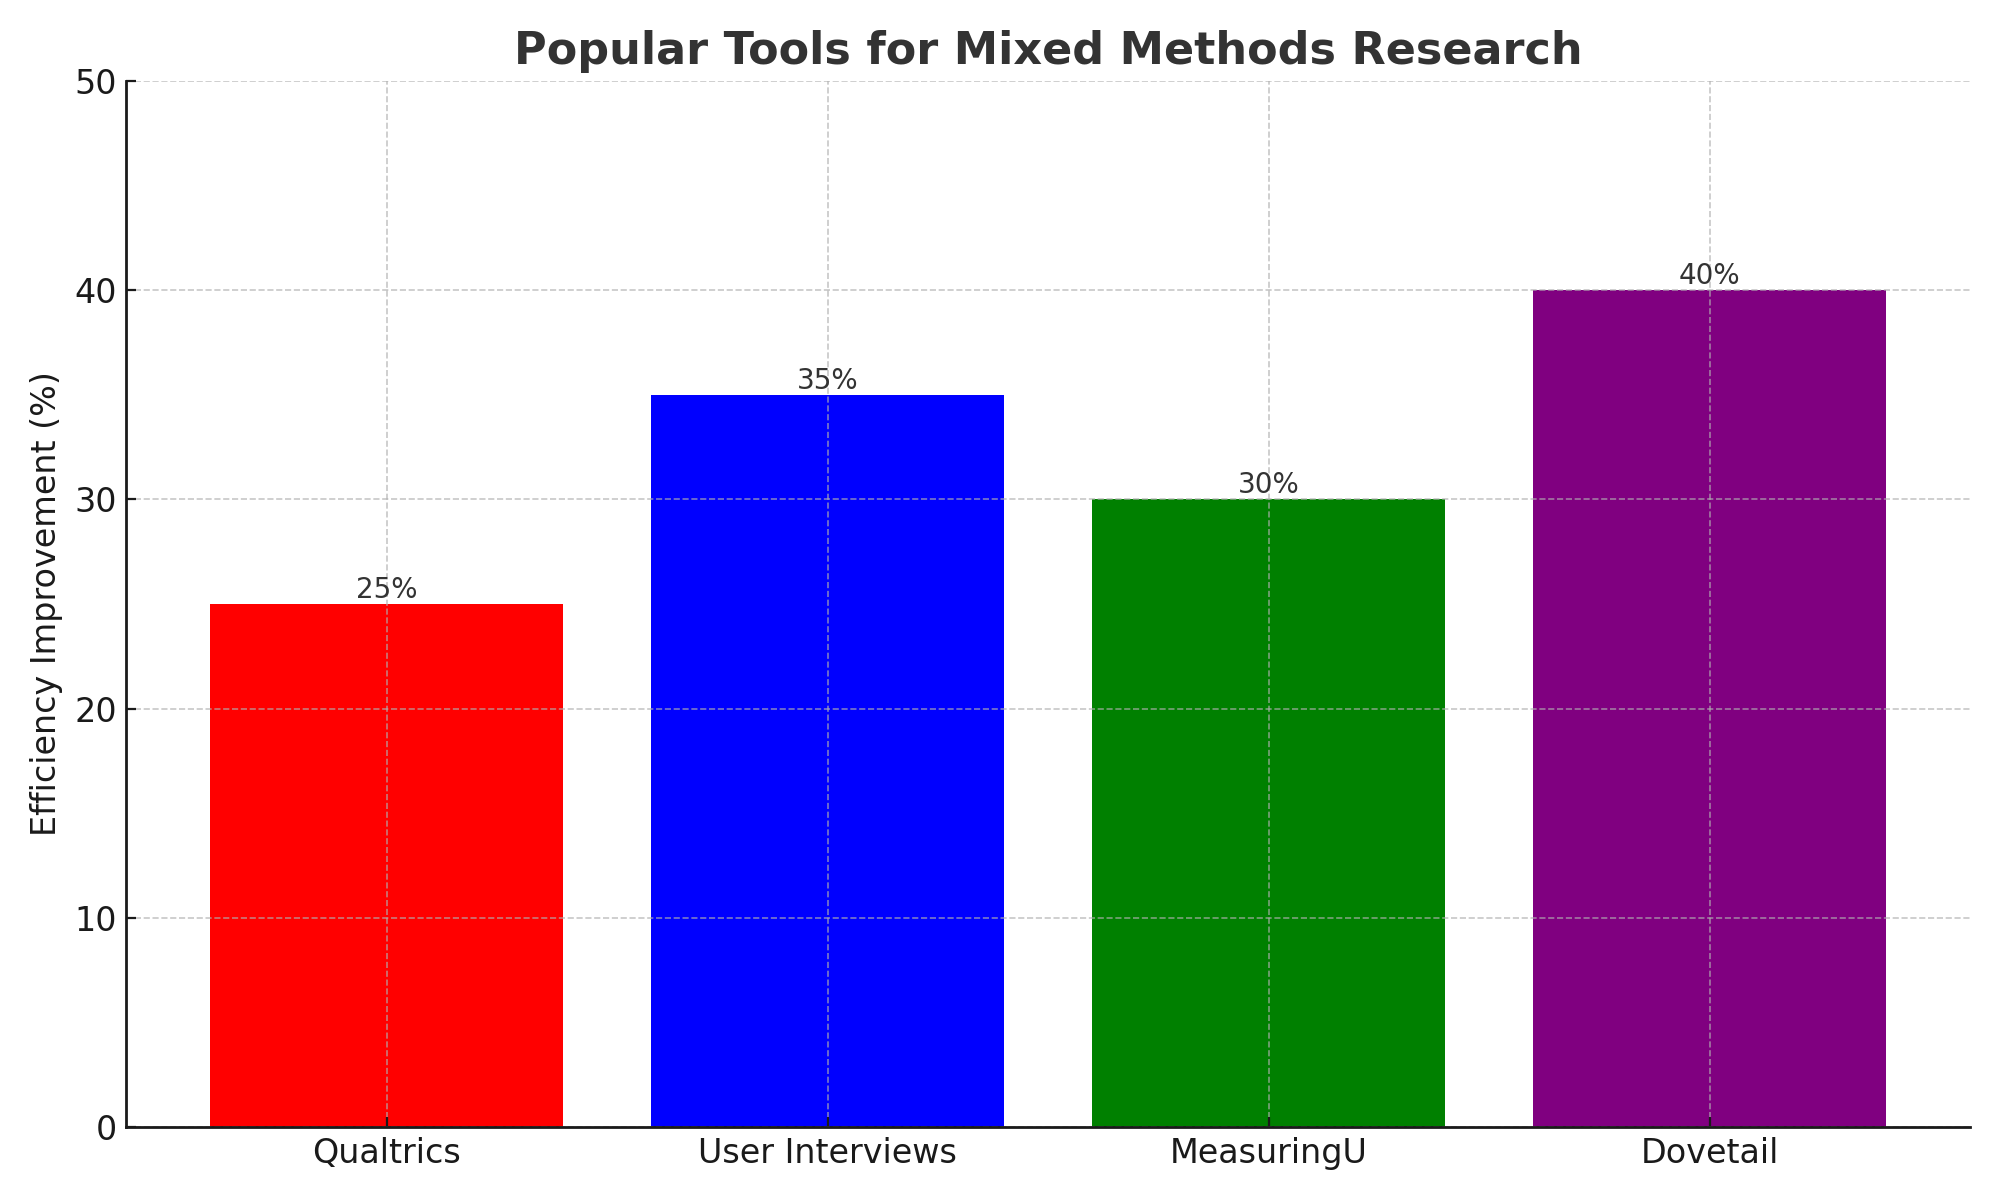
A bar chart comparing the efficiency improvements provided by popular tools: Qualtrics (25%), User Interviews (35%), MeasuringU (30%), and Dovetail (40%).
Qualtrics: An all-in-one platform for designing and analyzing surveys. Research shows that organizations using Qualtrics see a 25% increase in decision-making speed (Qualtrics, 2022).
User Interviews: A recruitment tool for finding the right participants.
MeasuringU: Specializes in UX benchmarking and quantitative feedback.
Dovetail: A platform for organizing and analyzing qualitative research.
Practical Steps to Implement Mixed Methods Research
Define Objectives: Establish clear research goals.
Recruit Participants: Use platforms like User Interviews to find relevant users.
Combine Methods: Mix qualitative and quantitative approaches for comprehensive insights.
Organize Data: Centralize findings in Dovetail.
Take Action: Use insights to inform design, strategy, and business decisions.
According to a Forrester report, companies that implement mixed methods research processes experience a 35% faster time-to-market for new features (Forrester, 2023)
Final Thoughts: Why Mixed Methods Matter
In an era where attention spans are fleeting, understanding users deeply is critical. Mixed methods research enables companies to create user experiences that not only meet but exceed expectations.
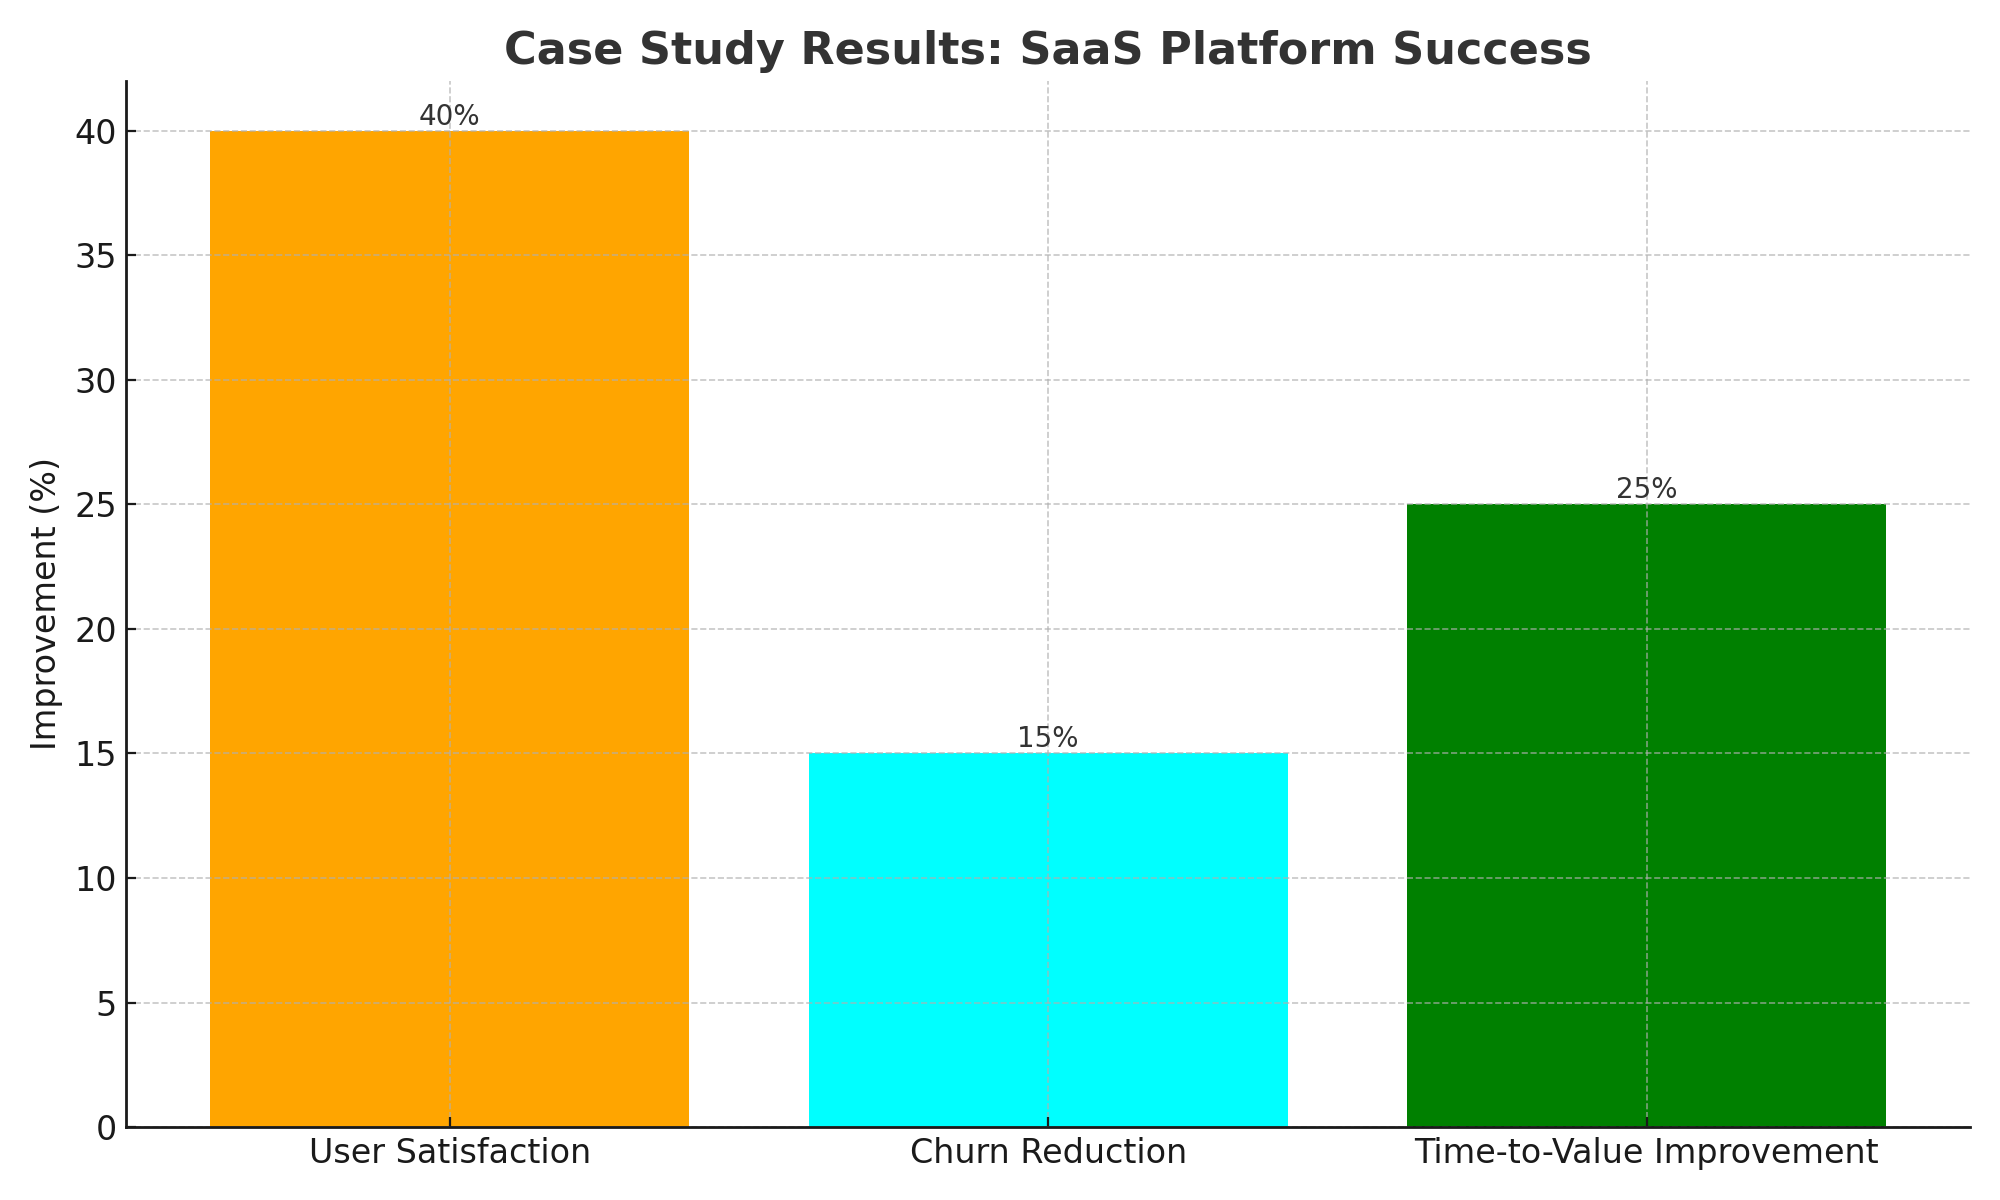
Case Study Results Dashboard
A bar chart summarizing the SaaS platform's success: 40% improvement in user satisfaction, 15% churn reduction, and 25% improvement in time-to-value.
By investing in tools like Qualtrics, User Interviews, MeasuringU, and Dovetail, businesses can gain a competitive edge. Research-backed strategies lead to better decisions, happier users, and stronger business outcomes. The time for guesswork is over—it’s time to let research lead the way.